
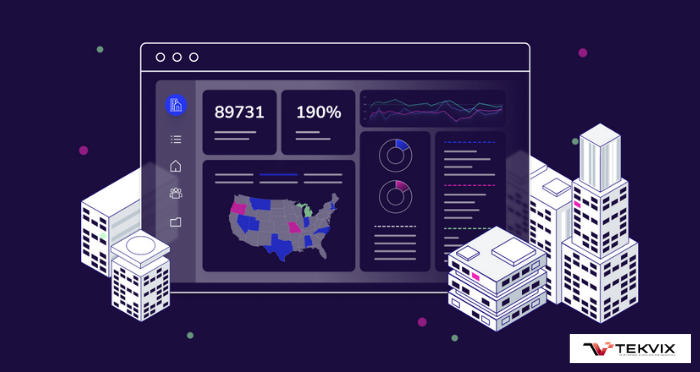
For decades, commercial real estate (CRE) was an industry built on relationships, intuition, and seasoned experience. A “gut feel” for a neighborhood, a handshake deal, and painstaking manual analysis of spreadsheets were the primary tools of the trade. While this art of the deal will always have its place, a powerful new science is reshaping the landscape: the rise of Real Estate Data Analytics Dashboards.
These sophisticated platforms are not just fancy spreadsheets; they are centralized, interactive command centers that aggregate, visualize, and analyze vast amounts of data in real-time. They are fundamentally transforming how investors, developers, brokers, and asset managers make critical decisions, moving the industry from reactive to proactive and from speculative to strategic.
This deep dive explores the multifaceted ways Real Estate Data Analytics Dashboards are revolutionizing commercial real estate, the key metrics they track, and how they are forging a new era of profitability and efficiency.
The Commercial Real Estate Data Revolution: More Than Just Numbers

The first step to understanding the power of a dashboard is appreciating the sheer volume and variety of data now available. Modern Real Estate Data Analytics Dashboards pull from a myriad of sources, creating a holistic view of a property or portfolio that was previously impossible.
Key Data Sources Integrated into Dashboards:
- Property-Level Data: Rent rolls, occupancy rates, lease expirations, operating expenses (OpEx), maintenance logs, and tenant satisfaction scores.
- Market & Macroeconomic Data: Local market vacancy rates, absorption rates, comparable sales (comps), new construction pipelines, demographic shifts, and employment data.
- Geospatial Data: Foot traffic analytics, proximity to amenities (transit, schools, retail), flood zones, and sun exposure.
- Financial Data: Interest rate forecasts, cap rate trends, debt market conditions, and REIT performance.
- IoT & Sensor Data: From smart buildings, including energy consumption patterns, space utilization metrics, and environmental conditions.
By synthesizing these disparate data streams, a single dashboard provides a 360-degree view of an asset’s performance and its potential, eliminating data silos and creating a single source of truth for all stakeholders.
How Real Estate Data Analytics Dashboards Reshape Core CRE Functions
The transformation brought by Real Estate Data Analytics Dashboards is evident across every function within the industry. Let’s break down their impact.
1. For Investment & Acquisition: De-risking the Multi-Million Dollar Bet
Acquiring a commercial property is a high-stakes gamble. Dashboards are turning this gamble into a calculated investment.
- Identifying Off-Market Opportunities: Advanced algorithms can scan public records, zoning changes, and ownership patterns to identify potential acquisition targets before they are officially listed.
- Accurate Underwriting & Valuation: Instead of relying on static spreadsheets, dashboards allow for dynamic underwriting. Investors can model different scenarios in real-time—”What if interest rates rise by 50 basis points?” or “What if we achieve a 5% higher rental rate?”—to instantly see the impact on IRR (Internal Rate of Return) and NPV (Net Present Value).
- Market Trend Analysis: Dashboards visualize cap rate compression/expansion, rent growth trends, and supply pipelines for specific submarkets, enabling investors to pinpoint markets poised for growth or decline.
2. For Asset & Property Management: Optimizing Performance Proactively
Once an asset is acquired, the focus shifts to maximizing its value. Dashboards empower asset managers to be proactive, not reactive.
- Portfolio Performance at a Glance: A dashboard can provide a high-level overview of an entire portfolio, highlighting underperforming assets, properties with high vacancy, or those exceeding their operating expense budgets.
- Lease Management & Retention: Automated alerts for lease expirations allow managers to initiate renewal conversations months in advance. By analyzing tenant payment history and service request data, managers can identify at-risk tenants and intervene to improve retention.
- Predictive Maintenance: By integrating IoT data from HVAC systems, elevators, and plumbing, dashboards can predict equipment failures before they happen. This prevents costly emergency repairs, reduces tenant disruption, and extends the lifespan of capital assets.
3. For Development & Construction: Building with Data-Backed Confidence
For developers, the pre-construction and construction phases are fraught with risk. Dashboards bring clarity and control.
- Site Selection & Feasibility Analysis: Developers can overlay demographic data, traffic patterns, competitor locations, and zoning regulations on a map to identify the optimal site for a new retail, multifamily, or industrial project.
- Cost & Schedule Tracking: Construction dashboards integrate with project management software to track budgets, timelines, and change orders in real-time. Any deviation from the plan is flagged immediately, allowing for swift corrective action.
- Pre-Leasing & Demand Forecasting: By analyzing current market leasing velocity and demand indicators, developers can more accurately forecast the pre-leasing timeline and adjust their marketing and capital strategy accordingly.
4. For Leasing & Brokerage: Closing Deals with Superior Insight
Brokers and leasing agents are using dashboards to gain a competitive edge and provide unparalleled value to their clients.
- Competitive Property Analysis: A broker can use a dashboard to instantly generate a report showing how their listing compares to competing properties on key metrics like price per square foot, amenities, and vacancy history.
- Targeting Ideal Tenants: By understanding the demographic and firmographic data of a successful tenant base in a specific area, brokers can more effectively target their marketing campaigns to similar prospects.
- Demonstrating Value to Clients: Instead of providing static PDF reports, a broker can give a client access to a live dashboard, allowing them to explore the data themselves and building trust through transparency.
How U.S. Real Estate Professionals Use Real Estate Data Analytics Dashboards
In the United States, the most effective real estate data analytics dashboards combine listing data, public records and economic indicators in one place. Brokers, investors, asset managers and property managers typically connect:
- MLS listing data delivered through the RESO Web API, giving active, pending and sold listings, days on market and price changes. See how we build MLS RESO data pipelines with Python and MySQL.
- Public property records from county assessor and recorder offices: ownership, tax assessments, deed transfers and mortgages.
- Economic and demographic data such as population, income and housing data from the U.S. Census Bureau American Community Survey and interest-rate series from FRED.
- Commercial market data from subscription providers covering lease comps, sales comps, vacancy and absorption by submarket.
- Internal data from property management, accounting and CRM systems: rent rolls, delinquencies, work orders and leads.
Bringing these sources together means a broker in Dallas, an investor in Phoenix or an asset manager in Chicago can compare submarkets, spot risk early and back every recommendation with data. For California brokerages, the same approach works on top of CRMLS listing data, as shown in our CRMLS IDX integration case study.
Predictive Analytics and AI in Real Estate Data Analytics Dashboards
The most advanced Real Estate Data Analytics Dashboards are moving beyond descriptive analytics (“what happened”) to predictive and prescriptive analytics (“what will happen” and “what should we do”).
- Rent Price Forecasting: Machine learning models can predict future rental rates for a specific asset class and location based on economic indicators, new supply, and historical trends.
- Tenant Churn Prediction: AI can analyze patterns in tenant behavior, payment history, and service requests to assign a “churn risk score,” enabling managers to prioritize retention efforts.
- Optimal Capital Allocation: Prescriptive analytics can recommend where to allocate capital for the highest return—whether it’s tenant improvements, a lobby renovation, or solar panel installation—based on projected ROI.
Choosing the Right Real Estate Data Analytics Dashboard: Key Features
Not all dashboards are created equal. When evaluating a Real Estate Data Analytics Dashboard platform, stakeholders should prioritize:
- Data Integration Capabilities: Can it seamlessly connect to your core systems (e.g., MRI, Yardi, Excel) and pull in live external data feeds?
- Customization & Flexibility: Can you build custom metrics, reports, and alerts that are specific to your investment thesis or management strategy?
- User-Friendly Visualization: Is the interface intuitive? Can users easily drill down from a high-level portfolio view to a single tenant’s lease details?
- Security & Access Controls: Does it offer robust security protocols and the ability to control data access for different users (e.g., analysts vs. principals)?
- Scalability: Can the platform grow with your portfolio, handling increased data volume and complexity without performance issues?
The Future is Integrated: The Role of Specialized Providers
As the demand for these powerful tools grows, specialized technology providers are emerging to offer tailored solutions that go beyond generic business intelligence software. These providers understand the unique workflows and data models of the commercial real estate industry.
One such company making strides in this space is Tekvix. By developing intuitive and powerful Real Estate Data Analytics Dashboards, Tekvix empowers firms to consolidate their disparate data sources into a single pane of glass. Their focus on actionable insights and user-friendly design helps teams, from analysts to C-suite executives, make faster, more confident decisions about their assets and portfolios. Leveraging a specialized platform like the one offered by Tekvix can be the key differentiator in a highly competitive market, turning raw data into a tangible competitive advantage.
Conclusion: Real Estate Data Analytics Dashboards Are Now Essential
The transformation is undeniable. The commercial real estate professional of the future will not be armed solely with a sharp suit and a Rolodex, but with a powerful real estate data analytics dashboard. This tool is no longer a “nice-to-have” for early adopters; it is rapidly becoming a “must-have” for survival and success.
The ability to make decisions based on comprehensive, real-time data—rather than outdated reports or instinct alone—leads to higher returns, mitigated risks, optimized operations, and a significant competitive edge. The era of flying blind is over. The era of data-driven clarity, powered by sophisticated dashboards, is here, and it is permanently reshaping the foundation of commercial real estate.
Real Estate Data Analytics Dashboards: Frequently Asked Questions
What is a real estate data analytics dashboard?
A real estate data analytics dashboard is an interactive tool that pulls property, market, financial and operational data into one view, so real estate professionals can track KPIs such as occupancy, NOI, cap rates, rent growth and days on market without building spreadsheets by hand.
Who uses real estate data analytics dashboards?
Commercial and residential brokers, real estate investors, asset and property managers, developers, lenders and REIT teams across the U.S. use them to evaluate deals, monitor portfolios and advise clients.
What data should a commercial real estate dashboard include?
At minimum: rent rolls, occupancy and lease expirations, operating expenses, comparable sales and leases, submarket vacancy and absorption, and interest-rate trends. Advanced dashboards add MLS data, foot-traffic and demographic data, and AI-based forecasts.
Should I buy an off-the-shelf dashboard or build a custom one?
Off-the-shelf tools work well for standard reporting. Real estate data analytics dashboards built for your business are better when you need to combine MLS feeds, internal systems and third-party data, or want proprietary scoring and forecasting that competitors cannot copy.
Need a Custom Real Estate Data Analytics Dashboard?
Tekvix builds real estate data analytics dashboards, MLS data pipelines and AI tools for U.S. brokerages, investors and PropTech companies. Learn more about our approach in RESO vs IDX, or contact Tekvix to plan your dashboard.
Need help with this? Learn about Tekvix real estate analytics dashboard development for U.S. brokerages, investors and PropTech teams.

Founder of Tekvix, brings 6 years of industry experience in web development with expertise in Python and JavaScript. He has contributed to diverse ML and web projects and now focuses on advancing AI solutions through Large Language Models (LLMs) and LangChains..
